
mysql
CREATE USER 'family'@'192.168.2.106' IDENTIFIED BY 'family';
GRANT ALL PRIVILEGES ON family . * TO 'family'@'192.168.2.106';
flush privileges;psql
CREATE DATABASE family;
CREATE USER family WITH SUPERUSER ENCRYPTED PASSWORD 'family';
GRANT ALL PRIVILEGES ON DATABASE family TO family;sudo apt-get install pgloader
pgloader mysql://family:family@pi4/family postgresql://family:family@pi6/family
Author: wplaat
Postgres automatic failover
sudo vi /usr/lib/postgresql/13/bin/pgfailover
#!/bin/bash
# Postgres HA (Master / Replication) monitoring script
# This script must only be installed on postgres slave (hot standby) nodePOSTGRES_MASTER_IP=pi6
POSTGRES_SLAVE_IP=127.0.0.1
POSTGRES_CHECK_PORT=23267
POSTGRES_FAILOVER='/usr/lib/postgresql/13/bin/pg_ctl -D /data02/data promote'status_master=$(curl --write-out %{http_code} --silent --output /dev/null $POSTGRES_MASTER_IP:$POSTGRES_CHECK_PORT)
status_slave=$(curl --write-out %{http_code} --silent --output /dev/null $POSTGRES_SLAVE_IP:$POSTGRES_CHECK_PORT)if [[ "$status_master" -eq 200 ]]
then
if [[ "$status_slave" -eq 206 ]]
then
echo "Master up - Slave Standbye - Do nothing"
else
echo "Master up - Slave down - Do nothing"
fi
else
if [[ "$status_slave" -eq 200 ]]
then
echo "Slave is Master - Do nothing"
elif [[ "$status_slave" -eq 206 ]]
then
echo "Slave becomes Master - Do action"
eval $POSTGRES_FAILOVER
exit 1;
else
echo "Master and Slave down - Do nothing"
fi
fiexit 0;
sudo chown postgres:postgres /usr/lib/postgresql/13/bin/pgfailover
sudo chmod a+x /usr/lib/postgresql/13/bin/pgfailoversudo crontab -u postgres -e
* * * * * /usr/lib/postgresql/13/bin/pgfailover
Postgres manually failover
How to failover from Master to Replication node and visa versa
Pi6 192.168.2.106 (MASTER)
Pi7 192.168.2.107 (REPLICATION)Make Replication node master
# Goto pi7
su postgres
/usr/lib/postgresql/13/bin/pg_ctl -D /data02/data promoteRestore old master
# Goto to pi6
sudo cp /data02/data/*.conf ../.
/usr/lib/postgresql/13/bin/pg_ctl -D /data02/data stop
rm -rf /data02/data/*
/usr/lib/postgresql/13/bin/pg_basebackup --pgdata=/data02/data --format=p --write-recovery-conf --checkpoint=fast --label=mffb --progress --host=pi7 --port=5432 --username=plaatsoft
rm /data02/data/standby.signal
/usr/lib/postgresql/13/bin/pg_ctl -D /data02/data start
psql -c "select * from pg_create_physical_replication_slot('standby1_slot');"# Goto to pi7
sudo cp /data02/data/*.conf ../.
/usr/lib/postgresql/13/bin/pg_ctl -D /data02/data stop
rm -rf /data02/data/*
/usr/lib/postgresql/13/bin/pg_basebackup --pgdata=/data02/data --format=p --write-recovery-conf --checkpoint=fast --label=mffb --progress --host=pi6 --port=5432 --username=plaatsoft
/usr/lib/postgresql/13/bin/pg_ctl -D /data02/data startCheck replication
CHECK MASTER NODE
postgres=# \x
postgres=# SELECT * FROM pg_stat_replication;postgres=# select pg_is_in_recovery();
pg_is_in_recovery
-------------------
f
(1 row)CHECK REPLICATION NODE
postgres=# \x
postgres=# SELECT * FROM pg_stat_wal_receiver;postgres=# select pg_is_in_recovery();
pg_is_in_recovery
-------------------
t
(1 row)
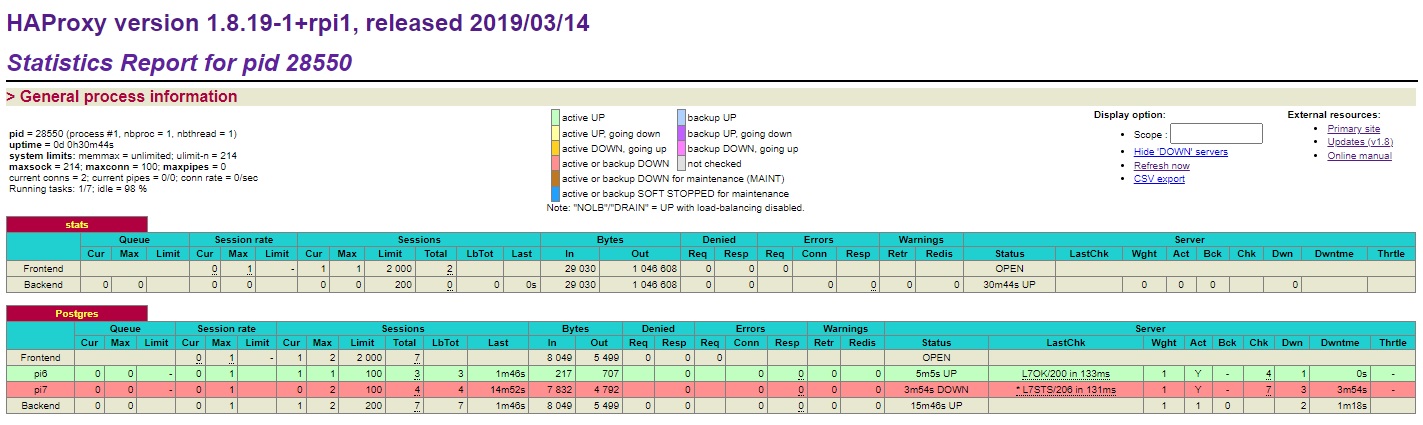
HaProxy for Postgres HA
Execute on each Postgresql node the following actions

# Create check script
sudo vi /usr/lib/postgresql/13/bin/pgsqlchk

#!/bin/bash
# This script checks if a postgres server is healthy running on localhost. It will return:
# "HTTP/1.x 200 OK\r" (if postgres is running smoothly)
# - OR -
# "HTTP/1.x 500 Internal Server Error\r" (else)
# The purpose of this script is make haproxy capable of monitoring postgres properly
# It is recommended that a low-privileged postgres user is created to be used by this script.
# For eg. create user healthchkusr login password 'hc321';

PGBIN=/usr/pgsql-10/bin
PGSQL_HOST="localhost"
PGSQL_PORT="5432"
PGSQL_DATABASE="postgres"
PGSQL_USERNAME="postgres"
export PGPASSWORD="passwd"
TMP_FILE="/tmp/pgsqlchk.out"
ERR_FILE="/tmp/pgsqlchk.err"

# We perform a simple query that should return a few results

VALUE=`/usr/lib/postgresql/13/bin/psql -t -h localhost -U postgres -p 5432 -c "select pg_is_in_recovery()" 2> /dev/null`
# Check the output. If it is not empty then everything is fine and we return something. Else, we just do not return anything.

if [ $VALUE == "t" ]
then
/bin/echo -e "HTTP/1.1 206 OK\r\n"
/bin/echo -e "Content-Type: Content-Type: text/plain\r\n"
/bin/echo -e "\r\n"
/bin/echo "Standby"
/bin/echo -e "\r\n"
elif [ $VALUE == "f" ]
then
/bin/echo -e "HTTP/1.1 200 OK\r\n"
/bin/echo -e "Content-Type: Content-Type: text/plain\r\n"
/bin/echo -e "\r\n"
/bin/echo "Primary"
/bin/echo -e "\r\n"
else
/bin/echo -e "HTTP/1.1 503 Service Unavailable\r\n"
/bin/echo -e "Content-Type: Content-Type: text/plain\r\n"
/bin/echo -e "\r\n"
/bin/echo "DB Down"
/bin/echo -e "\r\n"
fi

# Make script executable
sudo chmod a+x /usr/lib/postgresql/13/bin/pgsqlchk

# install xinetd and telnet
sudo apt-get install xinetd telnet -y

# Create xinitd file
sudo vi /etc/xinetd.d/pgsqlchk

service pgsqlchk
{
flags = REUSE
socket_type = stream
port = 23267
wait = no
user = nobody
server = /usr/lib/postgresql/13/bin/pgsqlchk
log_on_failure += USERID
disable = no
only_from = 0.0.0.0/0
per_source = UNLIMITED
}

sudo bash -c 'echo "pgsqlchk 23267/tcp # pgsqlchk" >> /etc/services'
sudo systemctl restart xinetd

# Check if service is working
telnet 127.0.0.1 23267

Trying 127.0.0.1...
Connected to 127.0.0.1.
Escape character is '^]'.
HTTP/1.1 206 OK
Content-Type: Content-Type: text/plain
Standby
Connection closed by foreign host.

Execute on HaProxy following actions

# Install HaProxy
sudo apt-get install haproxy -y

sudo vi /etc/hosts
Add pi6 192.168.2.106
Add pi7 192.168.2.107

sudo vi /etc/haproxy/haproxy.cfg

global
    maxconn 100

defaults
    log global
    mode tcp
    retries 2
    timeout client 30m
    timeout connect 4s
    timeout server 30m
    timeout check 5s

listen stats
    mode http
    bind *:10000
    stats enable
    stats refresh 10s
    stats uri /

listen Postgres
    bind *:5432
    option httpchk
    http-check expect status 200
    default-server inter 3s fall 3 rise 2 on-marked-down shutdown-sessions
    server pi6 pi6:5432 maxconn 100 check port 23267
    server pi7 pi7:5432 maxconn 100 check port 23267

systemctl restart haproxy

Check HaProxy

# Install postgres client
sudo apt-get install postgresql-client

# Start psql client
psql -h localhost -U postgres

postgres=# select pg_is_in_recovery();
pg_is_in_recovery
-------------------
f
(1 row)
Check HaProxy portal http://192.168.2.107:5000
PostgreSQL HA setup
How to setup High Available PostgreSQL on two nodes.
Pi6 192.168.2.106 (MASTER)
Pi7 192.168.2.107 (REPLICATION)Run below commands on both Pis:
sudo vi /etc/hosts
Add pi6 192.168.2.106
Add pi7 192.168.2.107sudo apt-get update
sudo apt-get upgrade
sudo apt-get install postgresql# Stop postgresql
sudo systemctl stop postgresql# Create directories
sudo mkdir /data02
sudo mkdir /data02/data
sudo chmod a+wrx /data02
sudo chown postgres:postgres /data02/data
sudo chmod 0700 /data02/data# Remove old databases
rm -rf /var/lib/postgresql/13/main
ln -s /data02/data /var/lib/postgresql/13/main
rm -rf /etc/postgresql/13/main
ln -s /data02/data /etc/postgresql/13/mainRun below commands only in Pi6 (MASTER):
# Create new database
/usr/lib/postgresql/13/bin/pg_ctl initdb -D /data02/data# Update PostgresSQL configuration
vi /etc/postgresql/13/main/postgresql.conf
Change #listen_addresses = 'localhost' to listen_addresses = '*'
Change #wal_level = replica to wal_level = replica
Change #max_wal_senders = 10 to max_wal_senders = 10
Change #wal_keep_size = 0 to wal_keep_size = 0vi /etc/postgresql/13/main/pg_hba.conf
Add next line
host all all 192.168.2.0/24 trust
host replication plaatsoft 192.168.2.0/24 trust# Start database
/usr/lib/postgresql/13/bin/pg_ctl -D /data02/data start
of
systemctl start postgresql# Create replication user
psql -c "CREATE USER plaatsoft WITH PASSWORD 'plaatsoft' REPLICATION;"5. Create replication slot on Primary Server
psql -c "select * from pg_create_physical_replication_slot('standby1_slot');"Run below commands only in Pi7 (REPLICATION):
# Create replication database based on master
/usr/lib/postgresql/13/bin/pg_basebackup --pgdata=/data02/data --format=p --write-recovery-conf --checkpoint=fast --label=mffb --progress --host=pi6 --port=5432 --username=plaatsoft# Update PostgresSQL configuration
vi /etc/postgresql/13/main/postgresql.conf# Update PostgresSQL configuration
vi /etc/postgresql/13/main/postgresql.conf
Change primary_conninfo to 'host=pi6 port=5432 user=plaatsoft password=plaatsoft'
Change primary_slot_name to 'standby1_slot'# Start database
/usr/lib/postgresql/13/bin/pg_ctl -D /data02/data start
of
systemctl start postgresqlFinal Check Pi6:
postgres 5211 1 0 13:04 ? 00:00:00 /usr/lib/postgresql/13/bin/postgres -D /data02/data
postgres 5215 5211 0 13:04 ? 00:00:00 postgres: checkpointer
postgres 5216 5211 0 13:04 ? 00:00:00 postgres: background writer
postgres 5218 5211 0 13:04 ? 00:00:00 postgres: walwriter
postgres 5219 5211 0 13:04 ? 00:00:00 postgres: autovacuum launcher
postgres 5220 5211 0 13:04 ? 00:00:00 postgres: stats collector
postgres 5221 5211 0 13:04 ? 00:00:00 postgres: logical replication launcher
postgres 5970 5211 0 13:13 ? 00:00:00 postgres: walsender plaatsoft 192.168.2.107(46242) streaming 0/12013F58Final Check Pi7:
postgres 23167 1 0 13:13 ? 00:00:00 /usr/lib/postgresql/13/bin/postgres -D /data02/data
postgres 23168 23167 0 13:13 ? 00:00:00 postgres: startup recovering 000000010000000000000012
postgres 23169 23167 0 13:13 ? 00:00:00 postgres: checkpointer
postgres 23170 23167 0 13:13 ? 00:00:00 postgres: background writer
postgres 23171 23167 0 13:13 ? 00:00:00 postgres: stats collector
postgres 23173 23167 0 13:13 ? 00:00:00 postgres: walreceiver streaming 0/12013F58
Raspberry Pi NFS
pi6 (NFS SERVER)
sudo apt-get install nfs-kernel-server# Create directory structure
sudo mkdir /data03
sudo chmod a+wrx /data03# Create NFS server file
vi /etc/exports
# Add below line at the end of the file
/data03 pi7(rw,sync,no_subtree_check)# Reinit NFS server
sudo exportfs -rapi7 (NFS CLIENT)
sudo mkdir /data03
sudo chmod a+wrx /data03# Temporary mount
sudo mount -t nfs -o proto=tcp,port=2049 pi6:/data03 /data03# Final mount
sudo vi /etc/fstab
pi6:/data03 /data03 nfs auto 0 0
Ansible on Raspberry Pi example
# Create master ansible node
sudo apt-get install ansible
sudo apt-get install sshpass -y

# Check version if ansible
ansible --version

# Create host file and add below lines
sudo /etc/ansible/hosts

[plaatsoft]
pi1
pi4
pi5
pi9

# update hostfile (Add all ansible target clients)
sudo vi /etc/hosts
pi1 192.168.2.101
pi4 192.168.2.104
pi5 192.168.2.105
pi9 192.168.2.109

# Generate private/public ssh key
ssh-keygen -t rsa
cat /home/pi/.ssh/id_rsa.pub

# Login each target client / created authorized_keys and insert public ssh key of ansible master node
vi .ssh/authorized_keys

# Ping all clients nodes
ansible all -m ping

# expected output
pi9 | SUCCESS => {
    "changed": false,
    "ping": "pong"
}
pi5 | SUCCESS => {
    "changed": false,
    "ping": "pong"
}
pi1 | SUCCESS => {
    "changed": false,
    "ping": "pong"
}
pi4 | SUCCESS => {
    "changed": false,
    "ping": "pong"
}

# Now create first playbook

mkdir /etc/ansible/playbook
mkdir /etc/ansible/playbook/files

vi /etc/ansible/playbook/hello1.yml

---
- name: first playbook example
  hosts: pi1 pi4 pi5 pi9
  tasks:
    - name: Create a file called '/tmp/hello1.txt' with the content 'hello world'.
      copy:
        content: hello world
        dest: /tmp/hello1.txt

# Execute first playbook
ansible-playbook hello1.yml

PLAY [This is a hello-world example] ************************************************************************************************************

TASK [Gathering Facts] **************************************************************************************************************************
ok: [pi5]
ok: [pi9]
ok: [pi1]
ok: [pi4]

TASK [Create a file called '/tmp/hello.txt' with the content 'hello world'.] ********************************************************************
ok: [pi9]
ok: [pi5]
ok: [pi1]
ok: [pi4]

PLAY RECAP **************************************************************************************************************************************
pi1                        : ok=2    changed=1    unreachable=0    failed=0
pi4                        : ok=2    changed=1    unreachable=0    failed=0
pi5                        : ok=2    changed=1    unreachable=0    failed=0
pi9                        : ok=2    changed=1    unreachable=0    failed=0

# Now create second playbook

vi /etc/ansible/playbook/files/hello.txt

ENTER SOME TEXT

vi /etc/ansible/playbook/hello2.yml

---
- name: This is a second example
  hosts: pi1 pi4 pi5 pi9
  tasks:
    - name: Create a file called '/tmp/hello.txt' with content
      copy:
        src: ./files/hello2.txt
        dest: /tmp/hello2.txt

# Execute second playbook
ansible-playbook hello2.yml

PLAY [This is a second example] *****************************************************************************************************************

TASK [Gathering Facts] **************************************************************************************************************************
ok: [pi5]
ok: [pi9]
ok: [pi1]
ok: [pi4]

TASK [Create a file called '/tmp/hello.txt' with content] ***************************************************************************************
changed: [pi9]
ok: [pi5]
changed: [pi1]
changed: [pi4]

PLAY RECAP **************************************************************************************************************************************
pi1                        : ok=2    changed=1    unreachable=0    failed=0
pi4                        : ok=2    changed=1    unreachable=0    failed=0
pi5                        : ok=2    changed=0    unreachable=0    failed=0
pi9                        : ok=2    changed=1    unreachable=0    failed=0
Maven settings.xml with Nexus entry
Zie https://upstreamwithoutapaddle.com/home-lab/nexus-pi/
<?xml version=”1.0″ encoding=”UTF-8″?>
<settings xmlns=”http://maven.apache.org/SETTINGS/1.1.0″
xmlns:xsi=”http://www.w3.org/2001/XMLSchema-instance”
xsi:schemaLocation=”http://maven.apache.org/SETTINGS/1.1.0 http://maven.apache.org/xsd/settings-1.1.0.xsd”>
<mirrors>
<mirror>
<id>nexus</id>
<mirrorOf>*</mirrorOf>
<url>https://nexus.plaatsoft.nl/repository/maven-public/</url>
</mirror>
</mirrors>
<profiles>
<profile>
<id>nexus</id>
<properties>
<altSnapshotDeploymentRepository>nexus::default::https://nexus.plaatsoft.nl/repository/maven-snapshots/</altSnapshotDeploymentRepository>
<altReleaseDeploymentRepository>nexus::default::https://nexus.plaatsoft.nl/repository/maven-releases/</altReleaseDeploymentRepository>
</properties>
</profile>
</profiles>
<activeProfiles>
<activeProfile>nexus</activeProfile>
</activeProfiles>
<servers>
<server>
<id>nexus</id>
<username>XXX</username>
<password>XXX</password>
</server>
</servers>
</settings>
WarQuest 7.3 (Game update!)
 Today there is a new update of WarQuest online!
This is the next release of WarQuest. This release contain the following changes and bug fixes:
Game Server
– Fixed bug that prevent registering of new players
– Fixed bug that prevent players of level zero to spend skill points on attack or defence
– Make all language code files UTF-8 complaint
– Update all copyright years to right year (2020)
– Removed some weird black bars in the announcement images
– Removed obsolete store links on the login page
– Add new Google Play Store download link
– Fixed some small layout issues
– Add theme Modern (Tablet / Desktop)
– Fixed the announcements when using an ad blocker
– Fixed gravatar http image loading bug on Android
– Update all http links to https and fixed all old domain names
– Added simple JSON REST API that the renewed WarQuest Android App uses
– Add bplaat (b.b.b.) to the developers (because he made this update)
Play
Click here to enter directly the game!
WarQuest 7.2
This is the next release of WarQuest. This release contain the following changes and bug fixes:
Game Server
– Fix bigint max value written to database.
Play
Click here to enter directly the game!
Webserver crash
Too bad one of my webservers crashed (Solid state disk failed) 3 days ago. I have roll in a new server and migrated all websites to this new server. If you miss something, please let me known.
I also updated the following software:
– Debian to buster
– WordPress to 5.4.1
PlaatService 0.5.0
 A new version of PlaatService was released
Version 0.5.0 (21-03-2020)
– Improve data model (sequence are now unique per table)
– Switch of json library. Make code better readable
– Add missing products
– Upgrade Log4j to 2.17.0
– Upgrade H2 to 2.0.202
– Upgrade junit to 4.13.1
– Upgrade httpclient to 4.5.13
PlaatService 0.4.0
A new version of PlaatService was released
Version 0.4.0 (20-03-2020)
– Rewritten in Java
– Added support for postgres database
– Added unit tests
– Source code is now stored in GitHub
Java KnightsQuest 0.5.0
 The next of KnightQuest was released.
It contain the following new features:
– Improve logging framework
– Added java doc in the source code
– Improve web services layer
– Added sound effects!
Click here to download the latest version.
Java RedSquare 0.4.0
 The next release of RedSquare for Java is released. The following changes are made:
18-03-2020 Version 0.4.0
– Move project to GitHub.
– Added JavaDoc
– Update Log4J2 framework.
– Update URL GeoCode WebService.
– Update WebService process logic.
– Remove Sonar warnings.
Click here to download the latest version.
PlaatService 0.3.0
A new version of PlaatService was released
Version 0.3.0 (18-03-2020)
– Final php version
PlaatService installation manual
Install java
step 1: sudo apt-get install openjdk-8-jdk
Install mysql
step 2: sudo apt-get install mariadb-server
Create database
step 3: sudo mysql -u root
CREATE DATABASE plaatservice;
CREATE USER ‘plaatservice’@’localhost’ IDENTIFIED BY ‘plaatservice’;
GRANT ALL PRIVILEGES ON plaatservice.* TO ‘plaatservice’@’localhost’;
FLUSH PRIVILEGES;
Deploy service
step 4: cp plaatservice.jar /home/pi
Start Service
step 5: sudo nohup java -jar plaatservice.jar
PlaatService 0.2.0
A new version of PlaatService was released
Version 0.2.0 (17-03-2020)
– Added score API
– Make it work with RedSquare, KnightQuest
– Make it work with PlaatEnergy, PlaatProtect
PlaatService 0.1.0
The first version of PlaatService was released
Version 0.1.0 (15-03-2020)
– Initial version based on PHP code
– Based on mysql database
Add java to Raspberry Pi
sudo apt-get install default-jdk
grant privileges for phpmyadmin
MariaDB. How to grant all rights to phpmyadmin?
sudo mysql -u root -p
# GRANT ALL PRIVILEGES ON *.* TO phpmyadmin@localhost;
# FLUSH PRIVILEGES;
# SHOW GRANTS FOR phpmyadmin@localhost;
PlaatDishes 0.3
![]()
The next version of PlaatDishes is released.
30-10-2019 Version 0.3
– Added icon
– Added user management page (admin mode)
– Added transaction page
– Bugfix: lplaat found a hack in to the system. This is now fixed!
– Bugfix: bplaat found a hack in to the system. This is now fixed!
PlaatDishes 0.2.0
![]()
The second version of PlaatDishes is released.
22-09-2019 Version 0.2
– Added email notification
– Added release notes page
– Added overview chart page
PlaatDishes 0.1.0
![]()
Today PlaatDishes is release. With this tool your can manage would have to do the wash dishes each day.
20-09-2019 Version 0.1
– Initial version
PlaatProtect 0.5
 This is the next release of PlaatProtect. The release contain the following changes and bug fixes:
– Added zigbee sensor inventory detection
– Added zigbee motion sensor support
– Added zigbee battery view
– Added daily database backup
– Improve table look-and-feel
– Improve email alarm notification
– Improve hue bulb alarm notification
Click here to download the latest version.